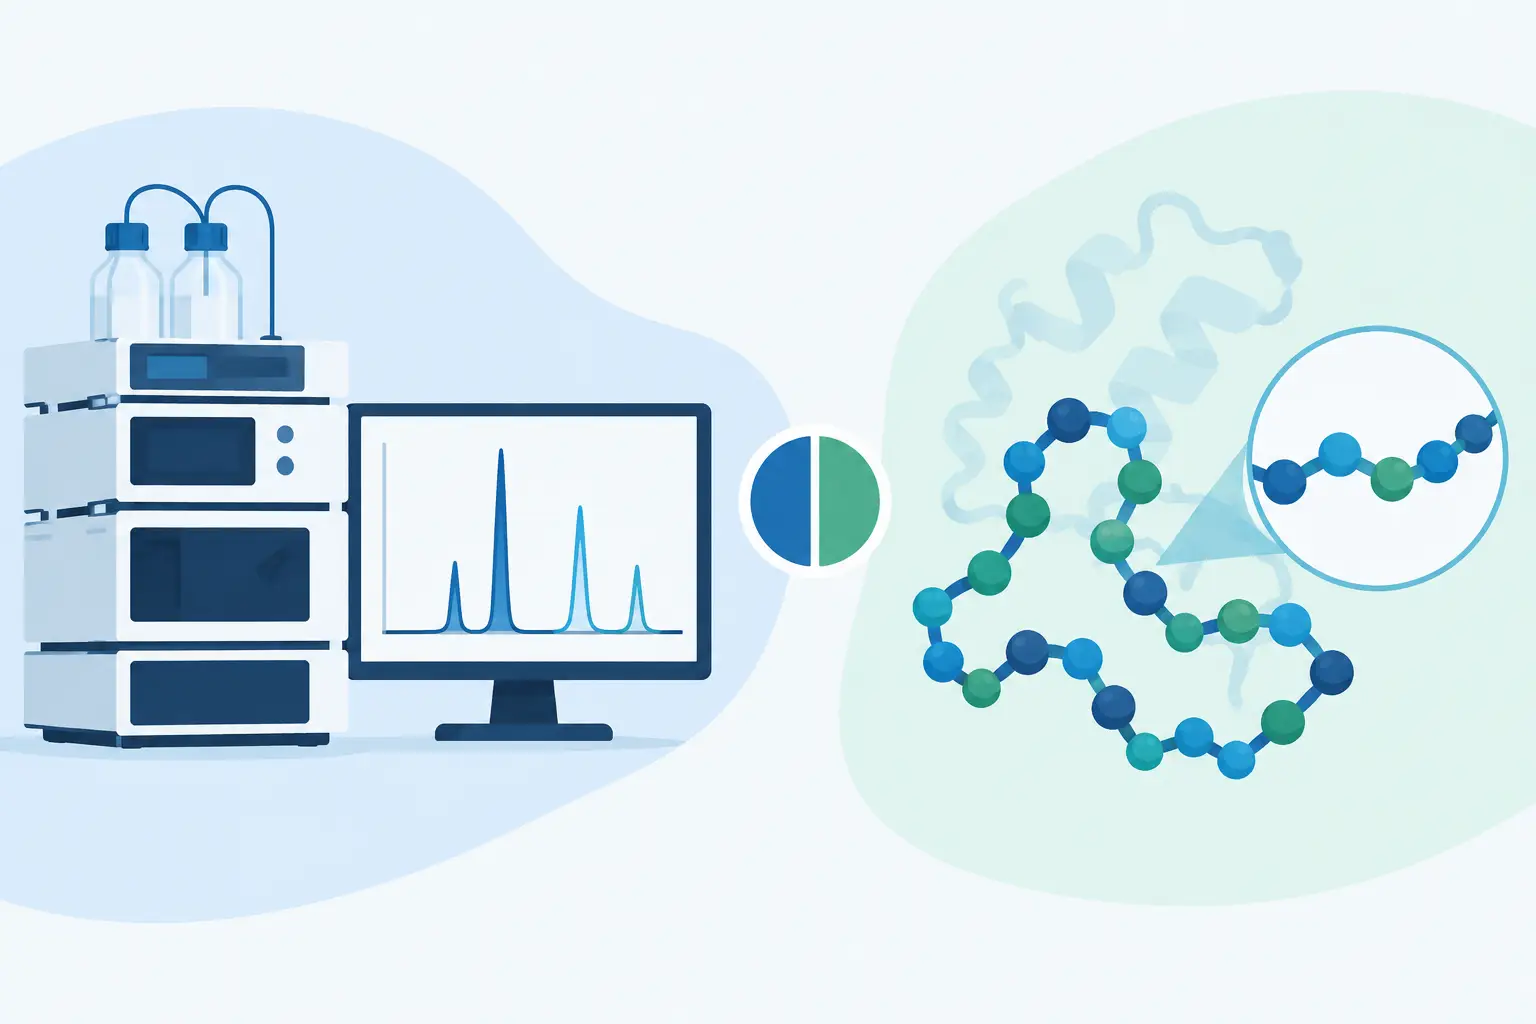
A vial can show 99% chromatographic purity yet contain materially less than 99% peptide by weight. That is not necessarily a contradiction. HPLC purity versus peptide content describes two different analytical questions, and confusing them can lead to inaccurate calculations, inconsistent experimental inputs, and poor purchasing decisions.
For research buyers, the distinction matters most when comparing batch Certificates of Analysis, assessing a stated vial quantity, or calculating the true amount of target peptide available after reconstitution. A credible quality review considers identity, chromatographic purity, peptide content, formulation and batch traceability together. No single result can establish all of them.
HPLC purity is a chromatographic measurement. It estimates how much of the detected chromatographic signal belongs to the target peptide relative to other detected peaks under a stated method. In practical terms, a reported HPLC purity of 99% generally means the target peak represented approximately 99% of the integrated peak area at the selected detection wavelength.
Peptide content, often described as assay or net peptide content, is a mass-based measurement. It answers a different question: how much of the material in the vial is actually the target peptide? This figure can be reduced by water, residual solvents, inorganic salts, counterions and other non-peptide components present in the lyophilised material.
A peptide may therefore be highly pure by HPLC while having a lower peptide content by mass. The HPLC result indicates that the peptide-related material is predominantly the intended compound. The content result indicates how much of the weighed powder is active peptide rather than associated material.
Both results are useful. Neither should be used as a substitute for the other.
High-performance liquid chromatography separates components in a sample according to their interaction with the column and mobile phase. For peptides, reversed-phase HPLC is commonly used. The target peptide elutes at a characteristic retention time, producing a peak that can be compared with other detected peaks in the chromatogram.
The reported purity is often calculated by peak-area normalisation. The target peak area is divided by the total integrated area of all relevant peaks, then expressed as a percentage. If the target peak accounts for 99 of every 100 integrated area units, the reported HPLC purity is 99%.
This is valuable evidence of chemical cleanliness, particularly when the chromatogram has clear separation and the method is appropriate for the sequence. It can reveal common process-related impurities, deletion sequences, oxidised variants, truncated material and residual synthetic by-products that produce distinct peaks.
However, HPLC purity is not a direct weight measurement. Ultraviolet detection depends on the peptide’s chromophores, the detection wavelength and the relative response of impurities. Some components may show weak UV absorbance or no meaningful signal at the selected wavelength. Co-eluting impurities may also be difficult to distinguish if the method does not adequately resolve them.
For that reason, a purity percentage should always be interpreted alongside the method details. Detection wavelength, column chemistry, gradient, retention time and integration approach all influence what the number represents. A purity claim without supporting analytical context is weaker than a batch-specific chromatogram and documented method.
Lyophilised peptides are not always composed solely of the peptide molecule. During synthesis, purification and freeze-drying, the final material may retain moisture, traces of processing solvent or acid counterions such as acetate or trifluoroacetate. Hygroscopic material can also take on water during handling if storage controls are inadequate.
These components add mass to the vial without representing target peptide. They may have little or no impact on the HPLC area percentage, particularly if they do not absorb strongly at the analytical wavelength. That is why a clean chromatogram does not establish the net quantity of peptide present.
Consider a nominal 10 mg vial. A batch may show 99% HPLC purity and 78% peptide content. The chromatographic result indicates that the peptide-related fraction is highly clean. The content result indicates that approximately 7.8 mg of the measured material corresponds to target peptide, subject to the stated assay method and uncertainty. The balance may consist largely of water and counterion rather than chemically related peptide impurities.
This does not mean the batch is poor quality. It means the result must be read correctly. For experiments requiring tightly controlled molar inputs, peptide content is often the more relevant figure for calculation. For assessing synthetic cleanliness and impurity profile, HPLC purity carries greater weight.
A complete analytical package addresses three separate questions. Is the material the intended peptide? How clean is it relative to detectable related substances? How much target peptide is present by mass?
Mass spectrometry addresses identity. It verifies that the observed molecular mass is consistent with the expected peptide, including the relevant charge states. It is a critical confirmation step, but mass spectrometry alone does not prove chromatographic purity or accurately quantify peptide content.
HPLC addresses separation and relative purity. It provides the clearest view of the primary peak and detectable chromatographic impurities under the conditions used. A reported value is strongest when it is supported by the underlying chromatogram rather than presented as an isolated percentage.
Assay or content testing addresses the quantity of peptide in the material. The method may involve amino acid analysis, calibrated UV measurement, quantitative nuclear magnetic resonance, elemental analysis or another validated approach. These methods do not have identical strengths or limitations. A Certificate of Analysis should identify the assay basis rather than leaving the term “content” undefined.
Start with the batch number. Every reported result should correspond to the specific lot supplied, not to a representative historical batch. Batch-level traceability is the foundation of a meaningful certificate.
Next, check identity confirmation. The expected and observed molecular mass should be consistent with the product’s stated sequence and modification. For modified peptides, even small mass differences can be analytically significant.
Then review the HPLC section. Look for the reported purity, chromatogram, detection wavelength and retention time. A single purity value is useful, but the chromatogram provides context. It shows whether the main peak is cleanly resolved, whether notable secondary peaks are present and whether the reported integration appears credible.
Finally, establish whether the certificate reports peptide content, assay or only nominal fill weight. These are not interchangeable. A stated vial size may refer to total lyophilised material or a specified peptide amount, depending on the supplier’s convention and documentation. Where exact molecular calculations matter, use the content value and declared salt form rather than relying only on the label quantity.
It is also worth checking the storage statement, date of analysis and analytical laboratory details. A well-controlled supply chain maintains the connection between verification, storage conditions and dispatch. Analytical quality can be compromised if material is mishandled after testing.
The right question is not simply, “What purity percentage is claimed?” Ask what the percentage measures, how it was determined and whether it belongs to the batch being offered.
A serious supplier should be able to provide independent HPLC and mass-spectrometry verification, batch-specific documentation and a clear account of its handling controls. If peptide content is relevant to the research application, the reporting method should also be available. Ambiguous phrases such as “laboratory grade” or “high purity” do not replace evidence.
For many research programmes, a high HPLC purity target is essential because related impurities can affect reproducibility. For quantitative work, peptide content is equally essential because it determines the real peptide mass used in a calculation. The appropriate priority depends on the experiment, but documented results should never be treated as optional.
G.O.A.T Peptides approaches this through batch-level verification, independent analytical review and traceable handling from sourcing through UK dispatch. The standard is straightforward: every vial should be supported by evidence that can be assessed, not merely claimed.
HPLC purity and peptide content are complementary measurements. One describes the relative cleanliness of the chromatographic peptide profile. The other describes the quantity of target peptide represented in the supplied material. Reading both correctly protects experimental consistency and makes comparisons between batches more meaningful.
Before preparing a critical study, retain the batch certificate with the experimental record, confirm the peptide form and content basis, and calculate from documented values rather than assumptions. That discipline turns a vial label into a controlled research input.